





Just like in previous years' surveys, the most satisfied travelers take the bus, but the difference is decreasing between flights, trains and buses.
This is evident from this year's study from the Swedish Quality Index focusing on passenger transport. Customers believe that all operators have shortcomings in handling delays.
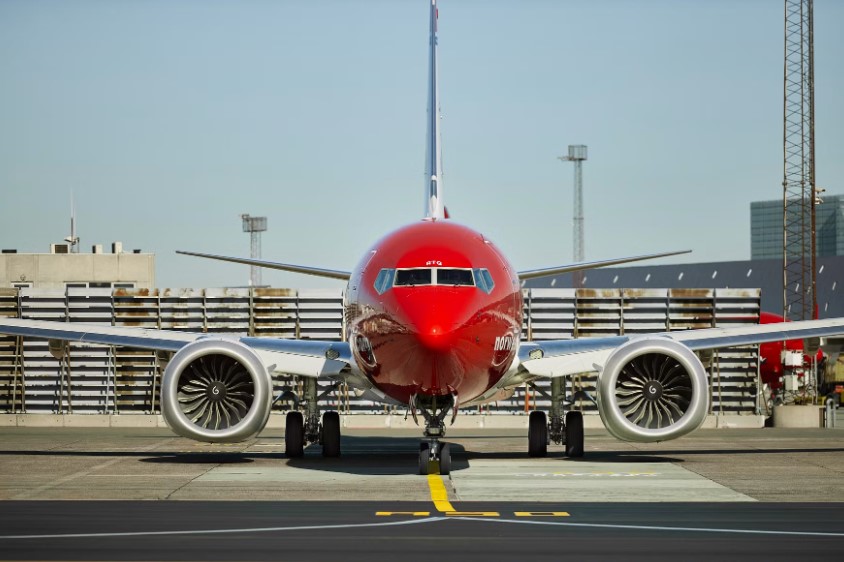
Previously, there has been a wide spread between how satisfied customers are with transport companies. This year, the tendency is rather the opposite. Among airlines, for example, it is extremely even between BRA, SAS and Norwegian and the difference between MTR Express and SJ is still large but the gap has narrowed. The industry has on average slightly better customer satisfaction than last year, 69.6 this year compared to 69.1 in 2017.
Nettbuss with its brands Nettbuss Bus4You and Nettbuss express once again received the best rating among all players in the survey.
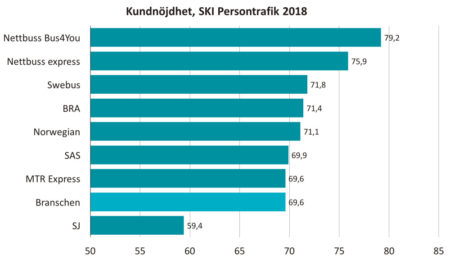
Satisfaction is measured on a scale between 0 and 100. Generally speaking, industries and companies that score below 60 in customer satisfaction have great difficulty motivating their customers to stay with them, while scores above 75 indicate a strong relationship between company and customer. Note that the group ”Industry” also includes all other players in the airline, train and bus industries.
– Bus companies have always had more satisfied customers than trains and planes, and we can conclude that this is the eighth year in a row that Nettbuss Bus4You has come out on top, comments Swedish Quality Index CEO Johan Parmler.
The train is chosen for environmental reasons
“Although the train industry remains low, we can note that SJ is constantly improving its results from the low levels measured shortly after 2010,” continues Johan Parmler. Punctuality is still SJ's major Achilles' heel, but it has actually become better and better in the eyes of customers.
Travelling with SJ is associated with many customers as environmentally friendly. Almost 3 out of 10 customers state that they travel with SJ for environmental reasons – which is by far higher than other players in the industry. Taking responsibility for sustainable social and environmental development is an increasingly important issue among customers. Here, both Nettbuss brands stand out positively among the bus companies, while BRA on the air side receives a relatively high rating.
Complaints about service lower customer satisfaction
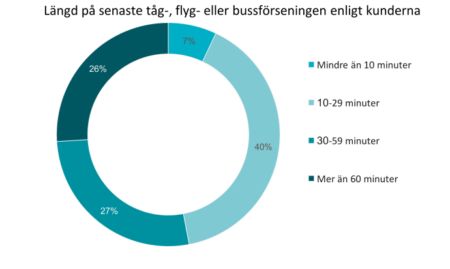
When studying the transportation industry, it is hard not to see the problem of delays. More than one in four customers have experienced delays in the past year. If there were delays on their most recent trip, around 40% of customers said the delay lasted between 10-29 minutes, 27% said it lasted up to an hour and 26% said it lasted more than an hour!
The high percentages make managing delays very important. Here we see that all players are failing this year and are receiving a large non-approval from their customers.
– Something that is really lagging behind is information in connection with the handling, which you might think is strange in today's situation with all the digital contact points that exist, says Johan Parmler. The lack of information in the event of disruptions is also something that has been highlighted in connection with the problems in rail traffic in recent days. Train operators are also being blamed for infrastructure problems outside their area of responsibility.
Note, about the 2018 study
The interviews were conducted during April-May 2018.
SKI's model analyses are based on structural equation models and an analysis method called partial least squares (PLS). It is a method that, in addition to calculating indices for, for example, image, customer satisfaction or loyalty, also reveals the strength of underlying relationships. It is through the chosen method that SKI can analyze
causal relationships and make statements about what affects satisfaction to the greatest extent. Generally, a difference of more than 2 index units is statistically significant. The Swedish Quality Index uses a 95% confidence level as standard.
Our experience is that industries and players that score below 60 in customer satisfaction have great difficulty motivating their customers to stay with them, while scores above 75 indicate a strong relationship between player and customer. Five areas explain what makes customers satisfied. As a background, image, expectations, product quality, service and value for money are measured.